
Monitoring software
Green Solution — environmental data, clear at a glance.
A software suite for managing environmental pollution monitoring data, for regulators and the community: a public information portal, a mobile app and internal operations software. Developed 100% in Viet Nam.
Three tools
One data system, three ways in.
Public web portal — state agencies publish information and data on environmental pollution for residents and businesses.
iOS and Android — environmental information and data for residents and businesses. Sign in with an issued account, or with a Google / Apple account.
Operations-support software, used internally by regulators and environmental officers.
Information portal
Look at the map, see at once where pollution is.
- Station list with preliminary readings; click a station to see detailed results
- Pollution-level colour codes: green — no pollution to brown — most severe pollution
- Map of station distribution by geographic location, showing AQI / WQI at each station
- Search stations by area or by monitoring group (domestic water, groundwater, wastewater, exhaust gas, ambient air…)
- Pollution rankings by AQI / WQI
- Latest data; readings above the safety threshold shown in red; hourly or daily charts
- Announcements: the latest regulations and notices from the regulator
- The public portal only publishes data measured, verified and approved for publication by state agencies
Operations
Not just viewing — you can operate, too.
- Alerts via website, mobile app and SMS when one or more indicators change abnormally / exceed thresholds
- Access permissions by user role
- Remote operation: change measurement/data-sending frequency, change alert thresholds, clean sensors (surface-water line), customise new features as customers require
- Automatic actuator control following the production process (aquaculture, agriculture)
- Data backed up and preserved on power loss; view and export data remotely (LoRa line)
- Mobile app: station list / map / rankings, detailed data with charts, notifications
AI forecasting
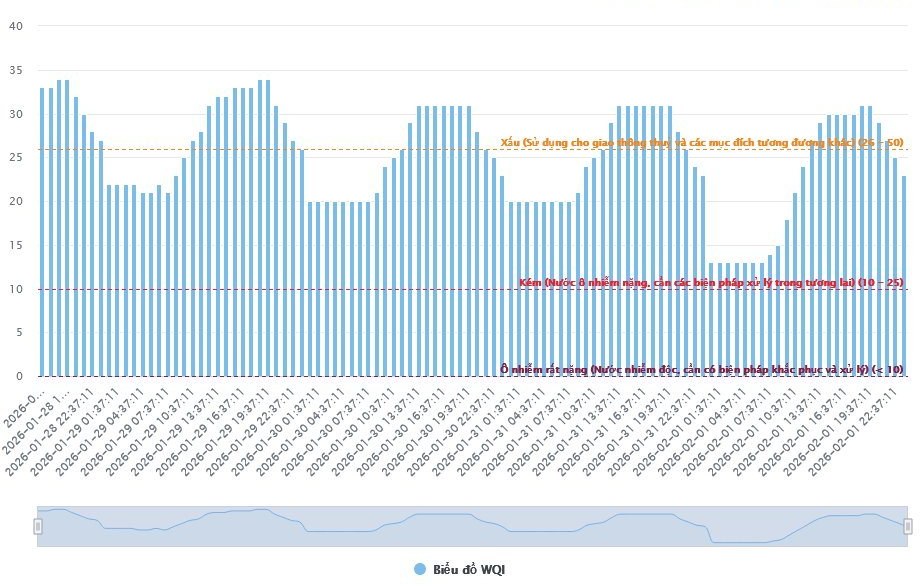
WQI / AQI forecasting — to prepare, not to guess.
The system analyses historical monitoring data to forecast water quality (WQI) and air quality (AQI) trends at each measuring point — supporting alert preparation, activity planning and response plans based on expected trends. WQI calculation and publication follow the method and parameter set in QCVN 08:2023/BTNMT and Decision 1460/QĐ-TCMT (VN_WQI).
Water quality forecasting. Already applied at the Hội An water monitoring station.
Air quality forecasting for air stations and dust monitors.
Forecast scope, horizon and accuracy depend on the data and model validation results at each point. AI supports managers; it does not replace on-site verification. An automated station does not automatically replace all sampling and analysis required by regulation.